Thinking about a move in Chastain Park and trying to make sense of the numbers you hear? You are not alone. With a mix of classic cottages and custom rebuilds, this north Atlanta neighborhood can move fast for some homes and slower for others. In this guide, you will learn which stats matter, how to read them for Chastain Park, and what they mean for your timing as a buyer or seller. Let’s dive in.
Why Chastain Park draws demand
Chastain Park centers around one of Atlanta’s largest park spaces, with trails, golf, tennis, ball fields, a pool, and a well-known amphitheater. That daily lifestyle access, plus nearby restaurants and services, creates steady interest. Proximity to Buckhead, Perimeter, and Cumberland job centers adds to demand, especially for professionals who value a shorter commute. The neighborhood’s prestige, tree-lined streets, and lot sizes also support long-term resale appeal.
What homes look like here
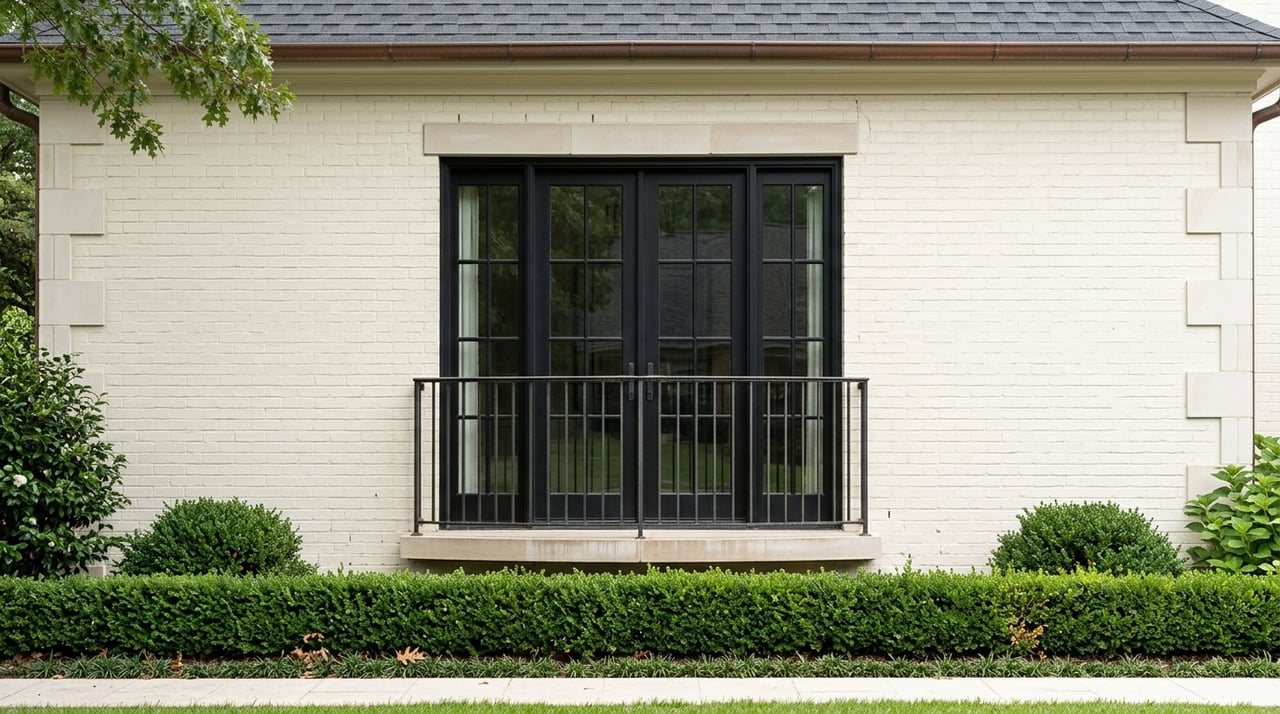
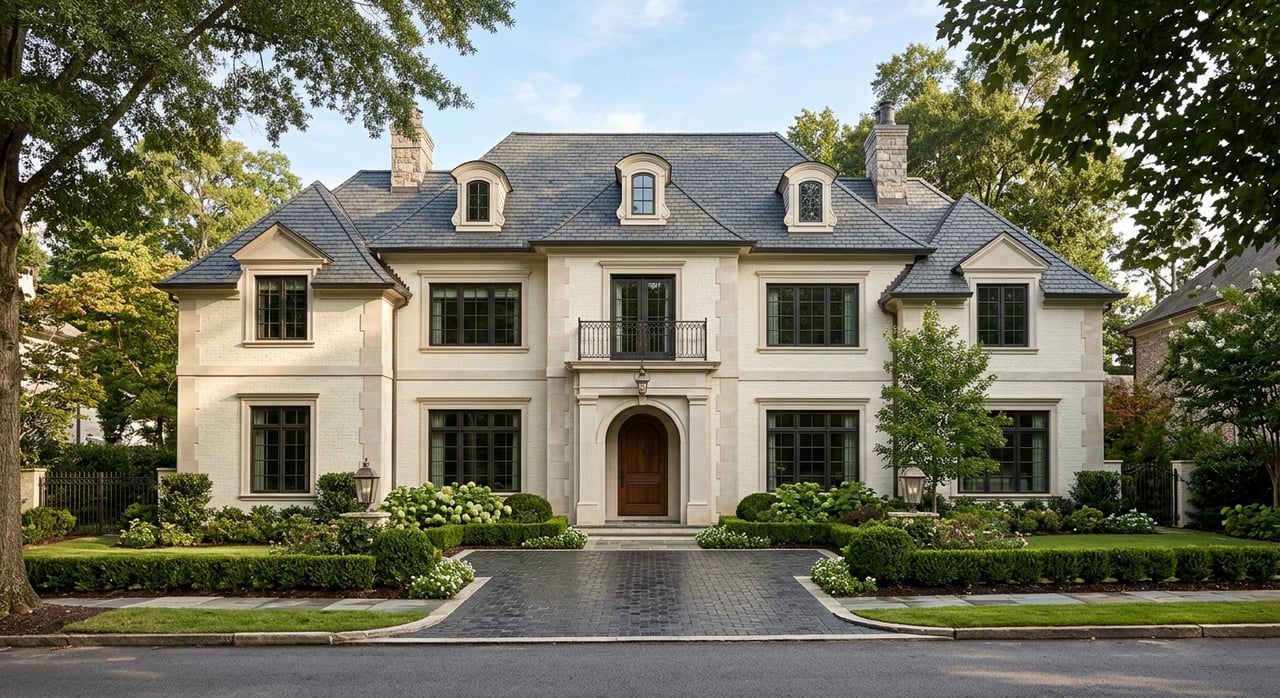
Housing is mostly single-family, ranging from early and mid-20th-century homes to high-end custom rebuilds. You will also find select townhome communities and a few small condo pockets along main corridors. Many resales have extensive renovations or full replacements, so condition and updates matter a lot when comparing price per square foot. Neighborhood-wide HOAs are uncommon, and coverage is usually limited to specific communities or townhome developments.
Key metrics to watch
Inventory and months of supply
Inventory is the number of active listings. Months of Supply is active listings divided by the average monthly sales, which estimates how long it would take to sell what is on the market at the current pace. As a rule of thumb, less than 3 months is a seller’s market, 3 to 6 months is balanced, and more than 6 months favors buyers. In Chastain Park, well-priced, updated single-family homes often run leaner supply than the city overall, while luxury or highly unique properties can take longer to absorb.
Median price and price per square foot
Median sale price is the midpoint of recent closed prices. Median price per square foot is the median of sale price divided by interior living area. Medians help reduce the impact of outliers, which is important in a neighborhood with everything from small cottages to large custom homes. For an apples-to-apples view, compare like properties by type, size, finish level, and lot.
Here is a simple example using hypothetical numbers: if the median price per square foot for similar single-family sales is $275, then a 2,400 square foot home might be roughly 2,400 × $275 = $660,000. Consider this a starting point. Lot quality, renovations, and unique features can move that estimate up or down.
Days to contract and DOM
Days on Market (DOM) often measures the time from listing to closing or removal and can reset if a home is relisted. A better gauge of buyer demand is days to contract, which tracks how long it takes to secure an accepted offer. In Chastain Park, updated homes that are priced well usually go under contract faster than the Atlanta average, while luxury estates, rebuilds, and off-market situations often have longer timelines. A rising days-to-contract trend can signal cooling demand or overpricing.
Sale-to-list price ratio
Sale-to-list ratio shows the final sale price divided by the list price. Above 100 percent can point to multiple offers. A range of 97 to 100 percent suggests buyers and sellers are meeting near the list price. In Chastain Park, turnkey homes commonly achieve stronger ratios, while properties that need renovation tend to sell below list.
New listings versus closed sales
Tracking new listings against closed sales helps you gauge momentum. If new listings consistently outpace closings, inventory builds and buyers gain leverage. When closings keep up with or exceed new listings, supply tightens and sellers hold the advantage.
Price trends and appreciation
To understand direction rather than noise, look at rolling 12-month medians for price and price per square foot. Local demand drivers include low supply, employment access, and park-area amenities. Rising interest rates or a surge of new supply can slow appreciation. Because Chastain Park can have small monthly sample sizes, avoid reading too much into a single month.
Seasonality in Chastain Park
Like many U.S. markets, spring is the busiest listing season, roughly March through June. Families who want to move around the school calendar often prefer spring, which increases buyer traffic and visibility. Summer remains active, while fall and winter usually see fewer listings but can bring more focused buyers. Amphitheater and park events drive neighborhood buzz but do not necessarily create immediate sales spikes.
If you need maximum exposure and potential for multiple offers, spring can help. If you value more predictable negotiations with less seller competition, off-peak months may fit your goals.
How to get current numbers today
For precise, up-to-date stats in Chastain Park, use local and MLS-backed sources:
- FMLS or Georgia MLS via a local agent for active, pending, and closed data, including days-to-contract and sale-to-list ratios.
- Atlanta REALTORS Association market reports for broader context and trends.
- Fulton County Tax Assessor and county GIS for lot sizes, parcel lines, and tax details.
- City of Atlanta planning and GIS for zoning and park overlays.
When you pull data, follow a simple process:
- Define your boundary. Use the MLS neighborhood field or draw a polygon that captures Chastain Park streets accurately.
- Choose your timeframe. Use the last 6 months for current conditions and 12 months for trend smoothing.
- Separate property types. Analyze single-family, townhomes, and condos independently so price per square foot comparisons are meaningful.
- Pull core fields. Include list date, list price, sale price, close date, days to contract, living area, lot size, year built, and status.
- Compute medians. Focus on median sale price, median price per square foot, months of supply, median days to contract, and the median sale-to-list ratio.
- Segment by price band. If the neighborhood spans multiple tiers, break out metrics for segments such as under $800,000, $800,000 to $1.5 million, and above $1.5 million.
Data tip: Small sample sizes are normal here. Use rolling 3 to 6 month medians and flag outliers like new-builds that are far larger or more customized than typical sales.
What this means for you
If you are buying
- If months of supply is low and days to contract are short, expect competition for well-priced, updated homes. Prepare a strong pre-approval, define your must-haves early, and consider offer terms that improve certainty for the seller.
- If inventory is rising and days to contract are lengthening, you may gain room to negotiate for credits, repairs, or contingencies.
- Use price per square foot as a quick gut check, not a final decision point. Only compare to similar homes with comparable size, finish level, and lot features.
- For older homes, be ready for maintenance considerations and set aside funds for systems, roofs, or cosmetic updates.
If you are selling
- If sale-to-list ratios are firm and days to contract are short, strategic pricing and solid preparation can spark multiple-offer outcomes.
- If inventory is climbing and the sale-to-list ratio is slipping, set a realistic price and invest in high-ROI improvements like paint, lighting, minor kitchen refreshes, and curb appeal.
- Homes that are unique or need renovation can still succeed if you choose a clear strategy. Price to sell quickly or position the property as an opportunity and plan for a longer marketing period.
- Request three to five recent comps that match your home’s condition, lot, and age. Use those to plan pre-list repairs, staging, and pricing.
Timing scenarios to consider
- You want top exposure. Aim for spring, when buyer traffic is typically strongest, and price with the current comps in mind.
- You value predictability. Consider late summer or fall, when there are fewer competing listings and more room for measured negotiations.
- You need a quick exit. If months of supply is low and your price band is tight on inventory, a competitively priced home that is move-in ready can capture early offers.
- You own a unique home. Plan for more days on market and a targeted marketing strategy that highlights the property’s specific value drivers.
Market snapshot checklist
Before you act, check these items for your price band and property type:
- Active inventory count and Months of Supply.
- Median days to contract for the last 90 to 180 days.
- Median sale price and median price per square foot, segmented by property type.
- Median sale-to-list price ratio.
- New listings versus closed sales in the last 30 to 60 days.
Pro tip: Add a simple note to any snapshot you share or save. Example: “Data current as of [Month Year], pulled from MLS for Chastain Park boundaries.”
Quick examples (hypothetical)
- Months of Supply: If there are 12 active listings and 4 closings in the last 30 days, MoS = 12 ÷ 4 = 3 months.
- Price per square foot: Comparable sales at $250, $275, and $300 per square foot produce a $275 median. A 3,000 square foot home could roughly price at 3,000 × $275 = $825,000 before adjustments.
- Sale-to-list ratio: A list price of $700,000 and sale at $722,000 equals 103.2 percent of list.
Get a custom Chastain Park snapshot
Every home here is unique, and the right plan depends on your price band, condition, and timing. If you want a clear, current read on inventory, days to contract, and pricing for your property type, reach out for a tailored market snapshot and next-step plan. Connect with Frank Nelson for neighborhood-level guidance and to Get Your Instant Home Valuation.
FAQs
How fast are homes selling in Chastain Park right now?
- Check the median days to contract for the last 90 to 180 days in the MLS, then compare to the Atlanta average to see if demand here is moving faster or slower than the broader market.
What does price per square foot mean for my Chastain Park home?
- Treat $/sq ft as a comparison tool only for similar homes by type, size, finish level, and lot; a simple estimate is living area multiplied by the median $/sq ft for truly comparable sales.
When is the best time to sell in Chastain Park?
- Spring typically offers the most visibility, but your best timing depends on current supply, interest rates, your price band, and how ready your home is for market.
Should I renovate before listing in Chastain Park?
- Smaller cosmetic updates often deliver better ROI than full remodels; consult recent comps to see which improvements buyers in your segment value most.
How do unique or luxury properties behave in this market?
- High-end or atypical homes can carry longer months of supply and days to contract, so plan for targeted marketing and a pricing strategy that reflects a more specialized buyer pool.